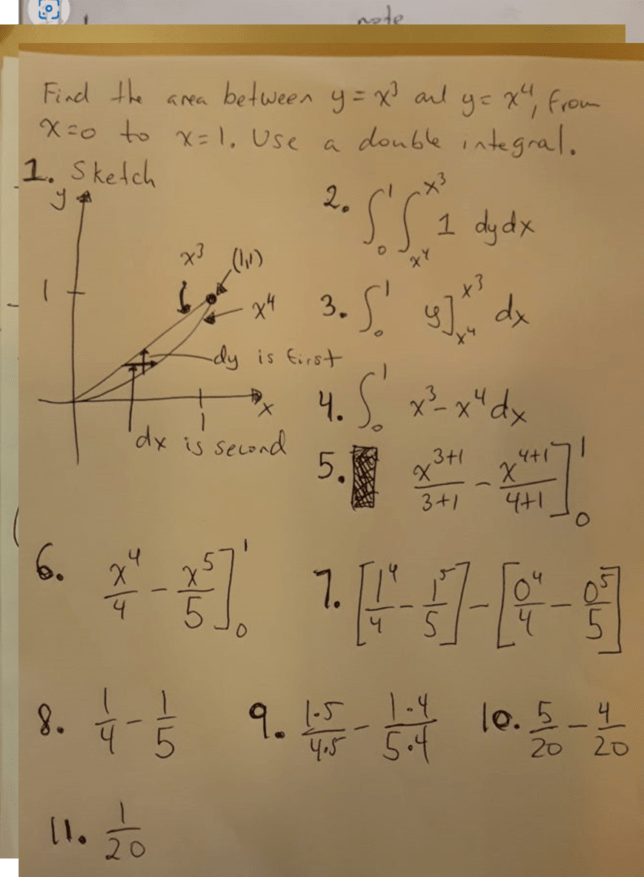
Original Question: Find the area between \( y = x^3 \) and \( y = x^4 \) from \( x = 0 \) to \( x = 1 \) using a double integral.
Step 1:
\[ \int \int dy \, dx \]
We start with the general form of a double integral. This sets the stage for integrating first with respect to \(y\) and then \(x\).
Step 2:
\[ \int_{0}^{1} \int dy \, dx \]
Next, we specify the limits for \(x\), which go from 0 to 1 as given in the problem.
Step 3:
\[ \int_{0}^{1} \int_{x^4}^{x^3} 1 \, dy \, dx \]
The integrand is 1 because we are finding the area between the curves. The area of a differential element \(dy \, dx\) is simply 1.
Step 4:
\[ \int_{0}^{1} \int_{x^4}^{x^3} dy \, dx \]
Now we set the limits for \(y\), which are determined by the equations \(y = x^3\) and \(y = x^4\).
Step 5:
\[ \int_{0}^{1} (x^3 – x^4) \, dx \]
We simplify the inner integral by subtracting the lower \(y\)-limit from the upper \(y\)-limit, resulting in \(x^3 – x^4\).
Step 6:
\[ \int_{0}^{1} x^3 \, dx – \int_{0}^{1} x^4 \, dx \]
We can separate this into two integrals for easier calculation.
Step 7:
\[ \left[\frac{x^4}{4}\right]_{0}^{1} \]
The integral of \(x^3\) is \(\frac{x^4}{4}\), and we evaluate this from 0 to 1.
Step 8:
\[ \left[\frac{x^5}{5}\right]_{0}^{1} \]
The integral of \(x^4\) is \(\frac{x^5}{5}\), and we also evaluate this from 0 to 1.
Step 9:
\[ \frac{1}{4} – \frac{1}{5} \]
We subtract the two results to get the final area between the curves.
Step 10:
\[ \frac{1}{4} – \frac{1}{5} = \frac{5}{20} – \frac{4}{20} = \frac{1}{20} \]
To find the numerical value of the area, we find a common denominator for the fractions, which is 20. After performing the subtraction, we get \( \frac{1}{20} \) as the final area between the curves.
Graphing the Area Between \(y = x^3\) and \(y = x^4\)
This guide explains how to graphically represent the area between \(y = x^3\) and \(y = x^4\) from \(x = 0\) to \(x = 1\), which we previously calculated to be \( \frac{1}{20} \) using a double integral.
Step 1: Set Up the Coordinate Plane
Draw the x-axis and y-axis. Label the x-axis from 0 to 1 and the y-axis according to the range of the functions.
Step 2: Plot \(y = x^3\)
Start at the origin and plot points for \(x\) between 0 and 1. Connect the points to form the curve.
Step 3: Plot \(y = x^4\)
Similarly, start at the origin and plot points for \(x\) between 0 and 1. Connect these points to form the second curve.
Step 4: Identify Intersection Points
The curves intersect at \(x = 0\) and \(x = 1\).
Step 5: Shade the Area
Shade the area between the two curves from \(x = 0\) to \(x = 1\).
Step 6: Label the Graph
Label both curves, the x-axis, and y-axis. Indicate the points of intersection and the shaded area.
Step 7: Relate to Integral
The shaded area represents the value we calculated using a double integral, which is \( \frac{1}{20} \).
