Finding the x-intercept:
2x + 3(0) = 6 ; Set y = 0 in the equation2x = 6 ; Simplify by multiplying 3 by 0
x = 3 ; Divide by 2 to solve for x
So the x-intercept is at the point (3, 0).
Finding the y-intercept:
2(0) + 3y = 6 ; Set x = 0 in the equation3y = 6 ; Simplify by multiplying 2 by 0
y = 2 ; Divide by 3 to solve for y
So the y-intercept is at the point (0, 2).
Graphing the Equation:
Graphing a Line By X and Y Intercepts
Finding the x-intercept:
4x – 2(0) = 8 ; Set y = 0 in the equation4x = 8 ; Simplify by multiplying -2 by 0
x = 2 ; Divide by 4 to solve for x
So the x-intercept is at the point (2, 0).
Finding the y-intercept:
4(0) – 2y = 8 ; Set x = 0 in the equation-2y = 8 ; Simplify by multiplying 4 by 0
y = -4 ; Divide by -2 to solve for y
So the y-intercept is at the point (0, -4).
Graphing the Equation:
Graphing a Line By X and Y Intercepts
Finding the x-intercept:
5x + 3(0) = 15 ; Set y = 0 in the equation5x = 15 ; Simplify by multiplying 3 by 0
x = 3 ; Divide by 5 to solve for x
So the x-intercept is at the point (3, 0).
Finding the y-intercept:
5(0) + 3y = 15 ; Set x = 0 in the equation3y = 15 ; Simplify by multiplying 5 by 0
y = 5 ; Divide by 3 to solve for y
So the y-intercept is at the point (0, 5).
Graphing the Equation:
Graphing a Line By X and Y Intercepts
Finding the x-intercept:
\(\frac{1}{2}x – \frac{1}{3}(0) = \frac{1}{6}\) ; Set y = 0 in the equation\(\frac{1}{2}x = \frac{1}{6}\) ; Simplify by multiplying -1/3 by 0
\(x = \frac{1}{3}\) ; Multiply by 2 to solve for x
So the x-intercept is at the point \(\left(\frac{1}{3}, 0\right)\).
Finding the y-intercept:
\(\frac{1}{2}(0) – \frac{1}{3}y = \frac{1}{6}\) ; Set x = 0 in the equation\(-\frac{1}{3}y = \frac{1}{6}\) ; Simplify by multiplying 1/2 by 0
\(y = -\frac{1}{2}\) ; Multiply by -3 to solve for y
So the y-intercept is at the point \(\left(0, -\frac{1}{2}\right)\).
Description of the Graph:
The graph of the equation \(\frac{1}{2}x – \frac{1}{3}y = \frac{1}{6}\) is a straight line that passes through the x-intercept at \(\left(\frac{1}{3}, 0\right)\) and the y-intercept at \(\left(0, -\frac{1}{2}\right)\). By connecting these two points with a straight line, you can visualize the graph of the equation.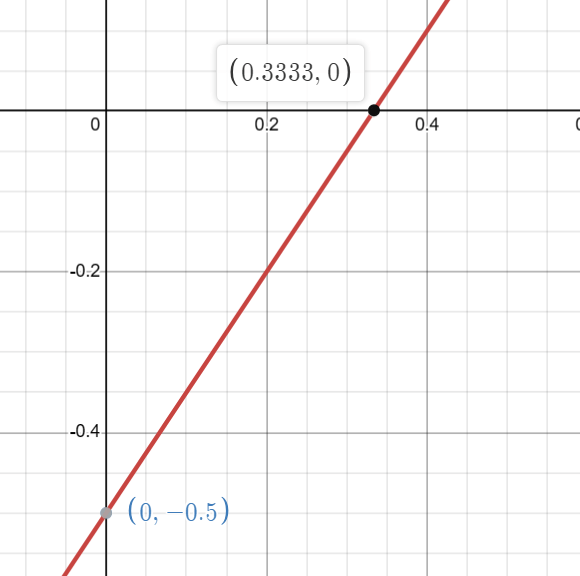
Graphing a Line By X and Y Intercepts
Original Equation:
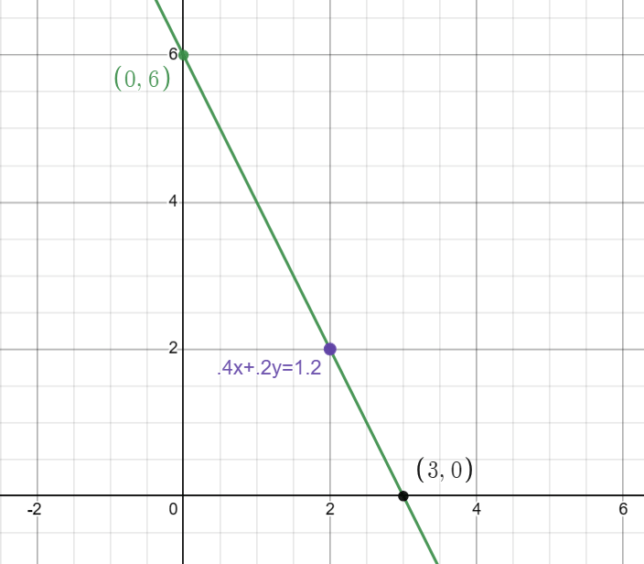
\(0.4x + 0.2y = 1.2\)Finding the x-intercept:
\(0.4x + 0.2(0) = 1.2\) ; Set y = 0 in the equation\(0.4x = 1.2\) ; Simplify by multiplying 0.2 by 0
\(x = 3\) ; Divide by 0.4 to solve for x
So the x-intercept is at the point \((3, 0)\).
Finding the y-intercept:
\(0.4(0) + 0.2y = 1.2\) ; Set x = 0 in the equation\(0.2y = 1.2\) ; Simplify by multiplying 0.4 by 0
\(y = 6\) ; Divide by 0.2 to solve for y
So the y-intercept is at the point \((0, 6)\).
Description of the Graph:
The graph of the equation \(0.4x + 0.2y = 1.2\) is a straight line that passes through the x-intercept at \((3, 0)\) and the y-intercept at \((0, 6)\). By connecting these two points with a straight line, you can visualize the graph of the equation.