
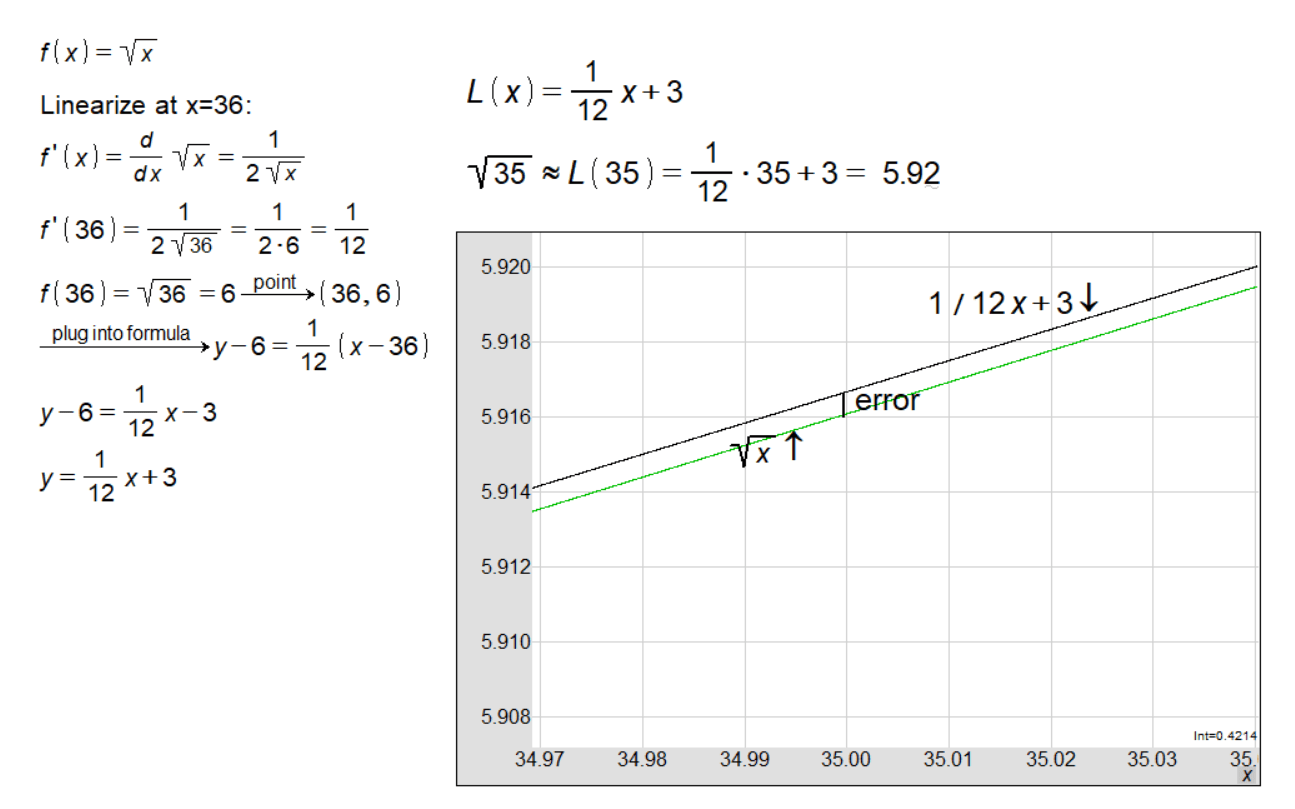
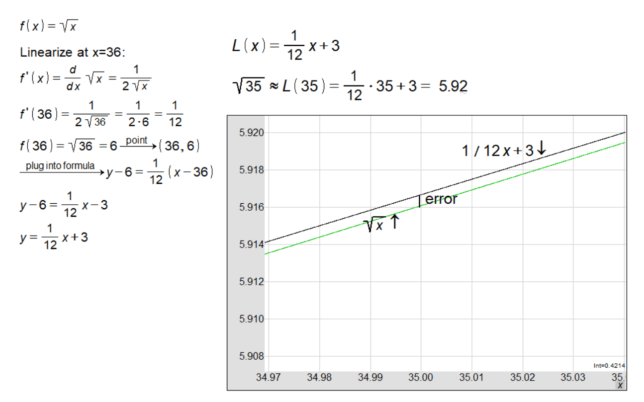
Understanding Linear Approximation: A graphical representation showcasing the linear approximation of the square root function, highlighting the process of linearizing at x=36. The derivative is calculated to find the slope, and the image illustrates the point of tangency on the curve where the linear approximation is applied. The tangent line equation is presented alongside the original function for a clear comparison. The close-up graph view emphasizes the minimal error between the actual function and the linear estimate near the point of tangency, offering an educational insight into the accuracy of linear approximations in calculus.