Unlocking the Secrets of f(x) = x²(x-1): A Comprehensive Visual Guide
Key Features of the Graph
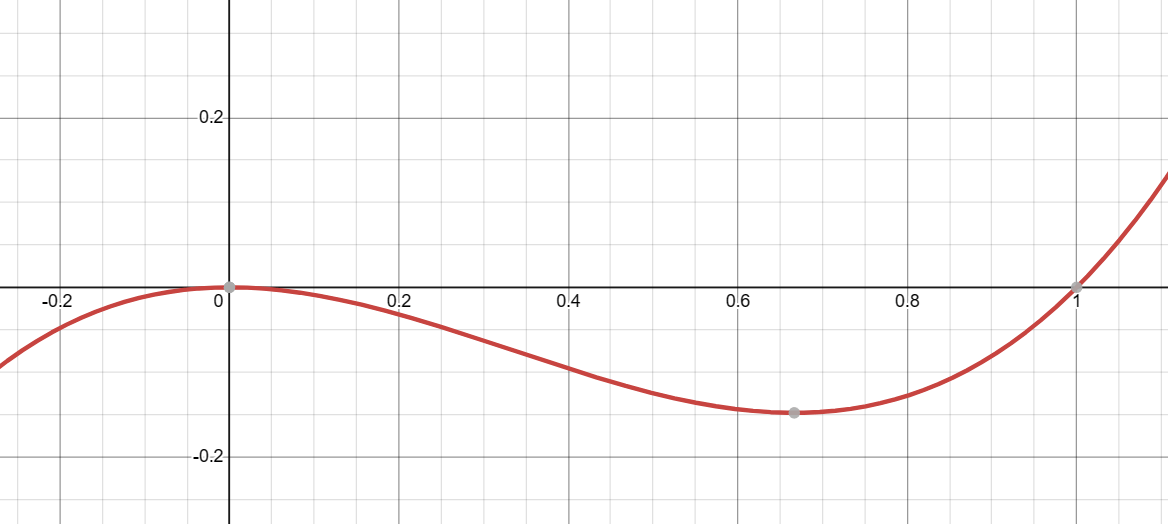
- Roots: The function has roots at x=0 and x=1.
- Multiplicities: The root at x=0 has a multiplicity of 2, causing the graph to “bounce” off the x-axis at this point. The root at x=1 has a multiplicity of 1, causing the graph to cross the x-axis at this point.
- End Behavior: As x approaches negative infinity or positive infinity, the function also approaches negative or positive infinity, respectively.
Why the Graph is Flatter at x=0
The graph appears flatter at x=0 due to the higher multiplicity of the root at this point. A higher multiplicity often results in the graph “slowing down” as it approaches the root, making it appear flatter.
Visual Characteristics
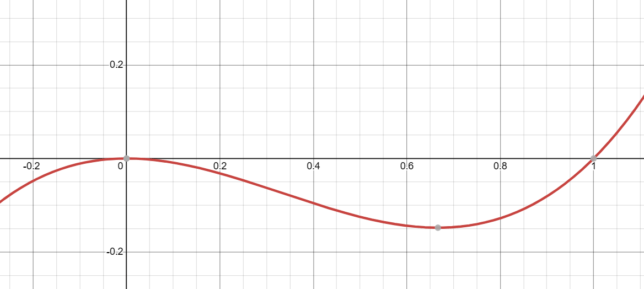
The graph starts from the third quadrant (bottom-left), “bounces” off the x-axis at x=0, dips back into the third quadrant, and then rises to cross the x-axis at x=1 before heading towards positive infinity.
The “bounce” at x=0 is more pronounced and flatter than the linear crossing at x=1 due to the higher multiplicity of the root at x=0.
Interpreting the Graph
The graph’s behavior is heavily influenced by the multiplicities of its roots. The “bounce” at x=0 and the linear crossing at x=1 are direct manifestations of these multiplicities.
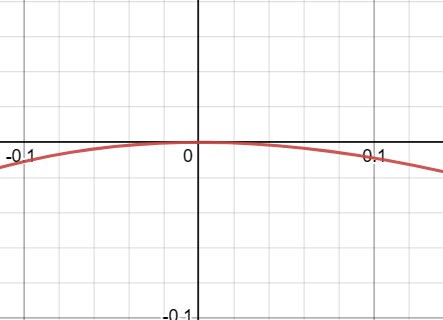
Zooming In: The Intricacies of f(x) = x²(x-1) Around x=0
Root and Multiplicity at x=0
The function has a root at x=0 with a multiplicity of 2. This multiplicity causes the graph to “bounce” off the x-axis at x=0 rather than crossing it.
Why the Graph is Flatter at x=0
Due to the higher multiplicity of 2 at x=0, the graph “slows down” as it approaches this root. This makes the graph appear flatter at x=0.
Visual Characteristics Near x=0
The graph emerges from the third quadrant (bottom-left), approaches x=0, and “bounces” off the x-axis. It does not cross the x-axis but instead reverses direction, heading back into the third quadrant.
Table of Values Around x=0
| x | x² | x-1 | f(x) = x²(x-1) |
|---|---|---|---|
| -0.1 | 0.01 | -1.1 | -0.011 |
| -0.01 | 0.0001 | -1.01 | -0.000101 |
| 0 | 0 | -1 | 0 |
| 0.01 | 0.0001 | -0.99 | -0.000099 |
| 0.1 | 0.01 | -0.9 | -0.009 |
Interpreting the Behavior
The “bounce” at x=0 is a direct manifestation of the root’s multiplicity of 2. The graph’s behavior around x=0 is heavily influenced by this multiplicity, causing it to reverse direction at this point rather than crossing the x-axis.